Aortic Stenosis: How the Echocardiogram Grades Severity
The measurements that define severe aortic stenosis, why low-flow states complicate the picture, and how often monitoring is needed — based on the British Society of Echocardiography 2021 practice guidelines.
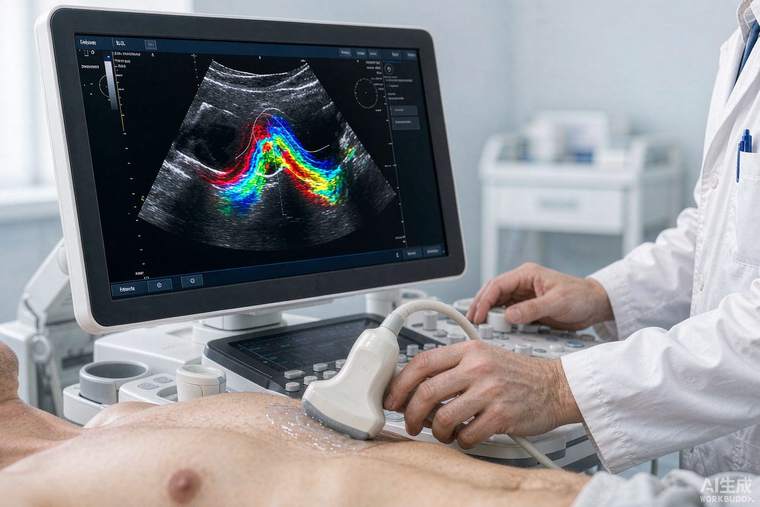
Aortic stenosis is narrowing of the aortic valve opening, forcing the left ventricle to pump against resistance. It is common with age, often silent for years, and its management turns almost entirely on one question: how severe is it, and has the heart begun to suffer? Echocardiography answers both, which is why a standardised scan is the backbone of care. This guide follows the 2021 British Society of Echocardiography practice guidelines for echocardiographic assessment of aortic stenosis.
What is measured
Three numbers define severity. Peak velocity across the valve (measured by continuous-wave Doppler) and the mean pressure gradient, which rise as the opening narrows; and the aortic valve area, calculated from the velocity-time integral using the continuity equation. Severe stenosis is generally a peak velocity of 4.0 m/s or more, a mean gradient of 40 mmHg or more, and a valve area of 1.0 cm² or less (or indexed to body size, under 0.6 cm²/m²). The guideline requires internal consistency — velocity, gradient and area should agree — and specifically flags the situation where they do not, rather than accepting a single number.
Why the numbers sometimes disagree
The commonest trap is low flow. If the heart is weak and cannot generate flow, a tight valve may produce only a modest gradient, making severe disease look moderate. Conversely, high-output states such as anaemia, pregnancy, fever or significant aortic regurgitation can exaggerate the gradient across a valve that is not that narrow. Additional clues resolve this: the valve's appearance and mobility, the degree of calcification, the left ventricle's thickness and pumping function, and — where the picture remains unclear — a low-dose dobutamine stress echo to see whether the gradient rises with flow, or a CT calcium score, which is now an accepted way of confirming severity when flow is low.
What the scan reveals beyond the valve
A complete study also looks at valve morphology (bicuspid, degenerative calcific, rheumatic), the amount of leak (regurgitation) coexisting with narrowing, the size and function of the left ventricle, the presence of pulmonary hypertension, and the other valves — because combined valve disease changes both timing and type of surgery. Symptoms — breathlessness, chest pain, dizziness or blackouts on exertion — are the trigger for intervention regardless of how impressive the numbers look, and a drop in blood pressure or exercise capacity on formal testing is equally important.
Monitoring intervals
Frequency of echocardiography is matched to severity: mild stenosis may be reviewed every three to five years, moderate every one to two years, and severe every six to twelve months — with immediate reassessment if any symptom develops. Patients are also advised to report symptoms promptly rather than waiting for the next scheduled scan, and to maintain good dental hygiene and seek advice before procedures carrying bacteraemia risk, since infected valves are a serious complication.
Before any decision
Where severity is uncertain, tests should be repeated and reconciled before intervention is proposed; a valve replacement undertaken for "borderline" measurements that were never confirmed is a preventable harm. Ask your team: which criteria are being used, do the measurements agree, and — if surgery or TAVI is proposed — what specifically has changed since my last scan.